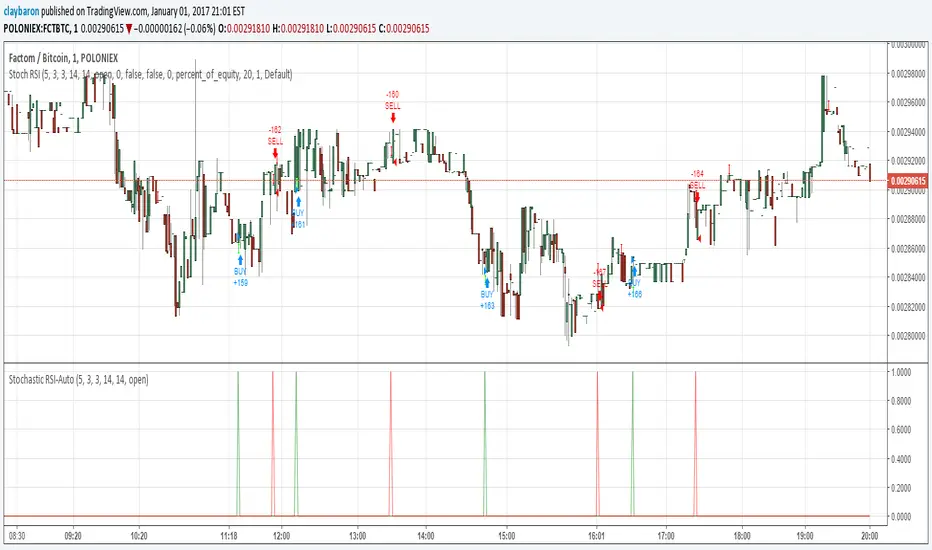
Stochastic RSI StrategyThis is an an adaption of Binary option 1 minute by Maxim Chechel to a strategy. I have had success with this on FCT/BTC on Poloniex.Strategi Pine Script®oleh DashTrader88 1.3 K
Smart Money Setup 08 [TradingFinder] Binary Options Gold Scalper🔵 Introduction In the Smart Money methodology, the market is understood as a structure driven by liquidity flow. This structure forms through the movement of large orders, the accumulation of liquidity, and the reactions that occur around key price zones. The logic of Smart Money is based on the idea that price movement is not random and usually evolves with the intention of collecting liquidity and creating price inefficiencies known as imbalances. Within this framework, several important stages including the liquidity sweep, the formation of a point of interest, the appearance of an imbalance and the transition of market structure play major roles and collectively define the broader direction of price. In many bullish scenarios, the market begins by sweeping sell side liquidity and targeting important lows in order to collect the liquidity resting below them. This liquidity collection often becomes the starting point for creating a point of interest which usually marks the area where Smart Money begins to enter the market. After price moves away from this point, it breaks a structural high and forms a change of character. This shift marks a transition in the balance of power between buyers and sellers and is considered the first clear signal that the market structure is changing. After the change of character, new institutional order flow often creates a strong and rapid movement that leaves behind an imbalance. This imbalance is one of the most important elements in Smart Money analysis because price tends to return to this area in order to complete structure and restore balance. The return into the imbalance becomes meaningful when it occurs together with the liquidity sweep, the presence of a validated point of interest and a confirmed structural transition. These conditions frequently mark the beginning of powerful movements within the Smart Money cycle. Understanding the sequence of liquidity, point of interest, imbalance, change of character and market structure builds the foundation of Smart Money analysis and provides a clear view of the true direction of institutional strength. Bullish Setup : Bearish Setup : 🔵 How to Use To use this framework effectively, the trader must analyze the market through the principles of Smart Money and observe how liquidity drives price. A trade becomes valid only when several essential components appear together in a clear and consistent order. These components include the liquidity sweep, the formation of a point of interest, the confirmation of a change of character, the transition of market structure and the return of price into an imbalance. The method is built on the understanding that the market first collects liquidity, then shifts order flow and finally provides an entry opportunity inside an inefficient area or inside a point of interest. For this reason, the trader must follow the path of liquidity from the moment the sweep occurs, through the point of interest and the change of character and finally into the return of price toward the imbalance. When applied correctly, this approach creates entries that are more precise, more structural and more aligned with the real behavior of the market rather than with superficial signals. 🟣 Long Position A bullish setup in Smart Money structure begins with a liquidity sweep on the sell side. The market first targets the areas where sell side liquidity is located and collects the stops and resting liquidity under previous lows. This collection is the condition that Smart Money requires to begin creating a new order flow. After this liquidity has been taken, a point of interest forms which is usually the last bearish candle or the effective demand zone that initiated the upward movement. Price then moves away from the point of interest and breaks a structural high which creates a change of character. This event confirms that the market structure has moved from a bearish state to a bullish one and that buying pressure has taken control of the order flow. Following this shift, a strong upward movement often occurs and creates an imbalance between candles. This imbalance reflects the entrance of strong Smart Money orders and is seen as an important confirmation of bullish strength. When price returns to this imbalance after the displacement, the market enters a phase where Smart Money aims to complete the corrective movement and continue the upward direction. The reaction inside the imbalance when combined with the liquidity sweep, the confirmed point of interest and the change of character completes the bullish setup and forms a structure that often leads to a continuation of the bullish trend. 🟣 Short Position A bearish setup follows the same Smart Money logic but in the opposite direction. The market begins by collecting buy side liquidity and targets the highs where buy side liquidity and resting stops are located. This liquidity sweep on the buy side becomes the starting phase for Smart Money to initiate a downward order flow. After the liquidity is collected, a bearish point of interest forms which is usually the last bullish candle or the supply zone that created the initial drop. Price then moves away from this point and breaks the first structural low. This creates a change of character to the downside which confirms that the market structure has transitioned from bullish to bearish and that selling pressure has gained control. After this shift, a strong downward displacement appears and leaves behind a bearish imbalance that clearly shows the dominance of sellers. As price returns to this imbalance and corrects the inefficient movement, the bearish setup becomes complete as long as the market structure remains bearish. The combination of the buy side liquidity sweep, the bearish point of interest, the change of character, the imbalance and the corrective return creates the ideal structure that Smart Money uses to continue the downward movement and develop a reliable selling opportunity. 🔵 Settings 🟣 Logic Settings Pivot Period : Defines how many bars are analyzed to identify swing highs and lows. Higher values detect larger, slower structures, while lower values respond to faster patterns. The default value of 5 offers a balanced sensitivity. 🟣 Alert Settings Alert : Enables alerts for SMS08. Message Frequency : Determines the frequency of alerts. Options include 'All' (every function call), 'Once Per Bar' (first call within the bar), and 'Once Per Bar Close' (final script execution of the real-time bar). Default is 'Once per Bar'. Show Alert Time by Time Zone : Configures the time zone for alert messages. Default is 'UTC'. 🔵 Conclusion The Smart Money approach demonstrates that price movement is not random or based on surface level patterns. Instead, it develops through a clear cycle of liquidity collection, structural transition and corrective movement toward key price zones. By recognizing events such as the liquidity sweep, the formation of the point of interest, the change of character and the return into the imbalance, the trader gains the ability to understand order flow more accurately and identify the true direction of market structure. Both bullish and bearish setups show that the alignment of these elements creates a transparent view of institutional behavior and reveals the source of strong movements in the market. When the trader correctly identifies this sequence, entry points become more reliable and more aligned with liquidity flow. The combination of liquidity, structure and imbalance provides a consistent framework that removes guesswork and guides decisions through the real logic of the market.Penunjuk Pine Script®oleh TFlab55 2 K
UP DOWN Indicator 1Title: UP DOWN Indicator based on ADX Strategy - Accurate Signal Provider with Enhanced Success Potential Description: The Martingale ADX Indicator is a groundbreaking tool meticulously crafted to offer traders unparalleled precision in signal generation and risk management. Leveraging the power of the Average Directional Index (ADX), this indicator provides 100% non-repaint signals on the current candle, guiding traders to opportune and prepare for trade entry with remarkable accuracy. With a focus on empowering traders across various financial markets, including Forex and Binary Options, this ADX Strategy-1 Indicator introduces a unique approach to trading dynamics. By seamlessly integrating the renowned Martingale Step-1 risk management strategy, this indicator not only minimizes losses but also enhances the potential for success, even in volatile market conditions. Key Features: Non-Repaint Signals: The Martingale ADX Indicator stands as a testament to reliability, offering 100% non-repaint signals. Traders can trust in the consistency and not removing losing Signals which is very important to trust the previous generated signals also, eliminating uncertainties and facilitating confident decision-making. ADX-Based Precision: Built upon the robust framework of the Average Directional Index (ADX), this indicator delivers precise signals tailored to prevailing market trends and volatility levels. Whether trading in longer timeframes or engaging in Binary Options, traders can rely on the Martingale Step-1 ADX Indicator for superior insights. Next Candle Trading: Seamlessly integrated into trading strategies, signals from the Martingale ADX Indicator prompt action on the subsequent candle. This real-time approach ensures traders stay ahead of market movements, seizing opportunities as they emerge. Giving Signals Once Candle ahead makes traders to prepare early and decide whether they want to enter the trade on presented Signal or not as per their own experience too. If the trading candle is loss then the very next candle shall be used for taking Martingale Sep-1 to enhance the Accuracy. Enhanced Success Potential: With Martingale Step-1 risk management, this ADX Indicator offers more than just signal accuracy – it presents the potential for heightened success rates. Through strategic position sizing and leveraging experience and Price Action insights, traders can elevate overall accuracy to levels ranging from 80% to 90%. Conclusion: The UP DOWN Strategy-1 Indicator represents a paradigm shift in trading technology, combining precision signal generation with advanced risk management strategies. Whether you're a seasoned trader or just starting your journey, this indicator empowers you to navigate financial markets with confidence and achieve consistent results. Experience the difference with the Martingale ADX Indicator – where reliability meets profitability, and success becomes attainable with every trade. Trade wisely, and may your ventures be marked by prosperity and fulfillment. Pardon for any descriptive language grammatical error and comment about this indicator and to get my other strategy as well. Happy trading !! Risk Disclaimer: Trading in financial markets carries inherent risks and should be approached with caution. It is imperative to exercise sound judgment and trade only with funds that you can afford to lose. We strongly advise against using borrowed funds for trading purposes. First practice on demo for own learning then make decision wisely.Penunjuk Pine Script®oleh arpitsharma009Telah dikemas kini 1616615
IU Probability CalculatorHow This Script Works: 1. This script calculate the probability of price reaching a user-defined price level within one candle with the help Normal Distribution Probability Table. 2. Normal Distribution Probability Table is use for calculating probability of events, it's very powerful for calculation of probability and this script is fully based on that table. 3. It takes the Average True Range value or Standard Deviation value of past user-defined length bar. 4. After that it take this formula z = ( price_level - close ) / (ATR or Standard Deviation) and return the value for z, for the bearish side it take z = (close - price level) / (ATR or Standard Deviation ) formula. 5. Once we have the z it look into Normal Distribution Probability Table and match the value. 6. Now the value of z is multiple buy 100 in order to make it look in percentage term. 7. After that this script subtract the final value with 100 because probability always comes under 100% 8. finally we plot the probability at the bottom of the chart the red line indicates "The probability of price not reaching that price level", While the green line indicates "Probability of price Reaching that level " . 9. This script will work fine for both of the directions How This Is Useful For The User: 1. With this script user can know the probability of price reaching the certain level within one candle for both Directions . 2. This is useful while creating options hedging strategies 3. This can be helpful for deciding stop loss level. 4. It's useful for scalpers for managing their traders and it can be use by binary option traders.Penunjuk Pine Script®oleh Shivam_MandraiTelah dikemas kini 2296
[STRATEGY][UL]QQE Cross v1.1Updated by request: this is a "Strategy" trading version of the "QQE Cross Indicator Alert v2.0 by JustUncleL" (which is mainly for Binary Options trading), the same BUY/SELL signals are used to generate trade entry and exit conditions. Thanks again to JayRogers for making the Strategy risk management easier to understand and implement. In this update I have added "Take Profit" option and cleaned up the risk management code. Also changed the close BUY/SELL order if EMA20 direction changes rather the next BUY/SELL opposite signal, making the close earlier. BE ADVISED TO USE AT YOUR OWN RISK, even though back testing has shown good results, I don't have any Forex trading account to forward test against. You need to perform these test yourself and get back to me if there is any issues. Strategi Pine Script®oleh JustUncleL3030 1.5 K
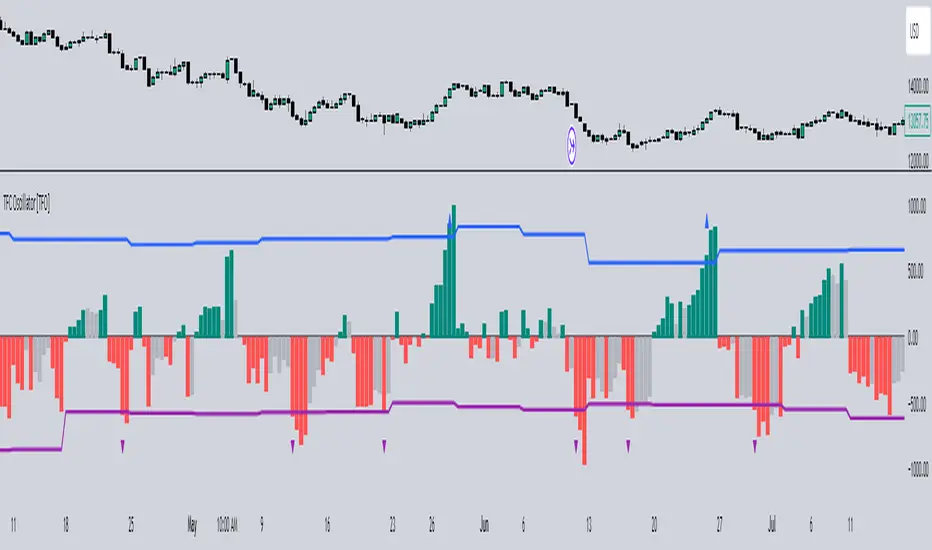
Timeframe Continuity Oscillator [TFO]This indicator is used to visualize timeframe continuity - a core concept of "The Strat" - along with some added logic for potential range limiters. When discussing timeframe continuity, typically we are evaluating several timeframes to see if price is trading above or below the current open of each respective timeframe. If we are concerned with the 15m, 4h, and 1D for example, and price is trading above the current open of each of those timeframes, we can say that we have full timeframe continuity (FTFC) up. Conversely, if price is trading below the current open of each of those timeframes, we can say that we have FTFC down. We can visualize this with an oscillator of sorts, where the zero line is anchored to the open price of the highest timeframe that we're concerned with. Using the prior example, this would be the 1D timeframe. As long as price is above the current 1D open, it is impossible to have FTFC down; and as long as price is below the current 1D open, it is impossible to have FTFC up. This is why we base the oscillator's values off of the highest timeframe's open (the values are simply how far price has traded from this open) - any value greater than zero tells us that there is potential to have FTFC up, and any value less than zero tells us that there is potential to have FTFC down. There are a few ways we chose to visualize this data. First, we can choose the "Binary" option which simply uses one solid bullish color above the zero line, and one solid bearish color below the zero line. Second, we can choose the "Gradient" option to help describe whether we have FTFC up or down. Values above the zero line will be a mix of the bullish color and mid color, where the mid color indicates no timeframe continuity up and the bullish color indicates FTFC up - sort of like a color spectrum of timeframe continuity to describe how many timeframes are in agreement. Similarly, values below the zero line will be a mix of the bearish color and the mid color, where the mid color again indicates no timeframe continuity down and the bearish color indicates FTFC down. Lastly, we can choose the "FTFC Only" option which will only color the histogram bars as bullish if there is FTFC up, or bearish if there is FTFC down. One more feature that we added is these upper and lower bands that aim to help describe the potential upper and lower limits that price may travel, relative to the highest timeframe's open. This is done by taking the standard deviation of some defined lookback period, for example, 2 standard deviations of the previous 10 weeks, assuming 1W is the highest timeframe enabled. The concept is similar to that of an ADR (average daily range) as it can be used to estimate maximum range extensions for the largest timeframe. The arrows you see are plotted once the value exceeds either band - alerts can be enabled for these events as well through any alert() function call.Penunjuk Pine Script®oleh tradeforopp88894
Om Boy CandlesUsed by me to play binary option. A little project to help my nephew decide which candle to refer to make SNR linesPenunjuk Pine Script®oleh DeniesKresnaTelah dikemas kini 2285
Binary Signals - MnetfGives binary options signals on NASDAQ. Signals long or short positions on the current candle in the NAS100 index. Is mostly perfect for long entry signalsPenunjuk Pine Script®oleh mhlangasimile1195
Hybrid Overbought/Oversold Detector + Put/Call SignalsThere are many indicators of overbought/oversold conditions out there. Some of more common ones are: - Bollinger Bands %B - Money Flow Index (MFI) - Relative Strength Index (RSI) - Stochastic This script uses a combination of these 4 oscillators to confirm overbought/oversold and filter the signals of market reverse which could be used for trading binary options. You may select which oscillators you want to apply and of course change the source, the length of the calculations and the overbought/oversold levels. Also the script will draw a combined graph which is the average of the selected oscillators in the options. Send me your ideas!Penunjuk Pine Script®oleh informanerdTelah dikemas kini 3939 1.1 K
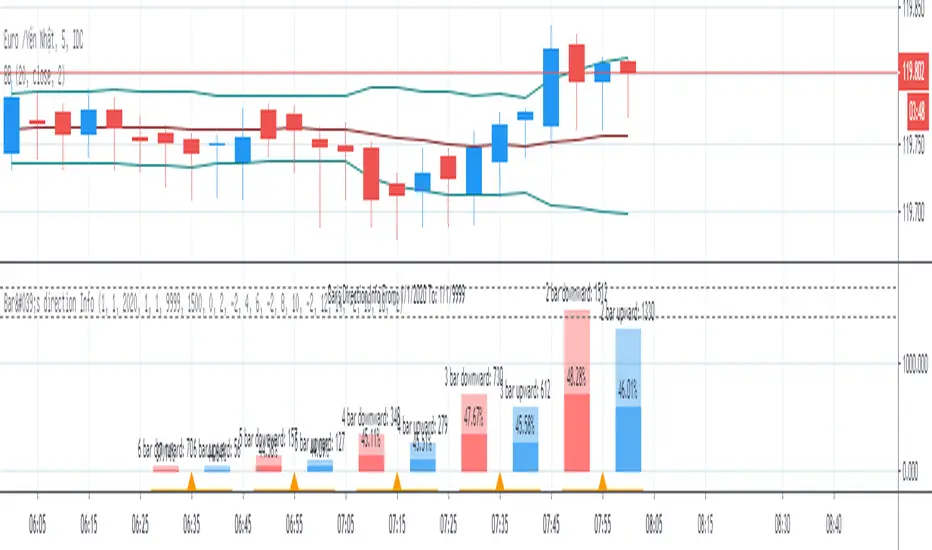
Bar's direction InfoBar's direction Info show number of case which bars have same direction and counting percent of next bar's direction. This info may be useful to trade Binary Option.Penunjuk Pine Script®oleh inno14Telah dikemas kini 44169
Momentum Strategy, rev.2This is a revised version of the Momentum strategy listed in the built-ins. For more information check out this resource: www.forexstrategiesresources.comStrategi Pine Script®oleh capissimo55108
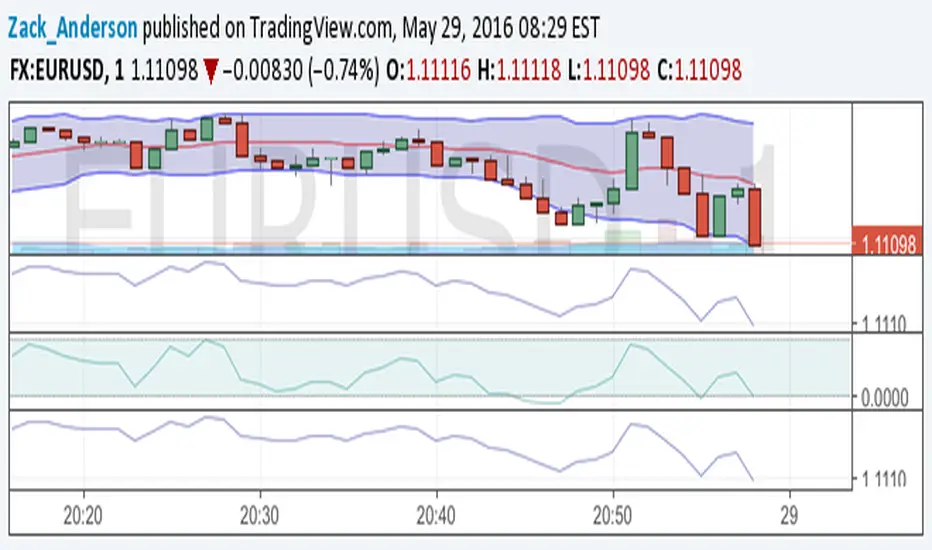
Bollinger Bands NEW var tradingview_embed_options = {}; tradingview_embed_options.width = 640; tradingview_embed_options.height = 400; tradingview_embed_options.chart = 's48QJlfi'; new TradingView.chart(tradingview_embed_options); Vdub Binary Options SniperVX v1 by vdubus on TradingView.com Penunjuk Pine Script®oleh Zack_Anderson1194
M & W Checklistindicator to Validate & Grade M & W Patterns. Indicator Inputs Table Color Palette • Position Valid : Positions the Valid Trade table on the chart. • Position Grade : Positions the Grade table on the chart, hover over the Column 1 Row 1 for a description of the bands. • Size: Text size for all tables. • Text Color : Sets text color. • Border Color : Sets the table border color for all tables. • Background Color : Sets table backgroud color for all tables. Valid Trade Table Checkboxes to indicate if the trade is valid. Fail is displayed if unchecked, Pass if checked. Grade Table • S/R Level 1: distance between neckline and 1st resistance area in % of the total distance between neckline and take profit. This is not for road blocks but pivot points etc before the initial run up/down in price. I have this set to 30% , this means that if there is a pivot point between the neckline and 30% of the TP level I weight it negatively. • S/R Level 2: distance between neckline and 1st resistance area in % of the total distance between neckline and take profit. This is not for road blocks but pivot points etc before the initial run up/down in price. I have this set to 50% , this means that if there is a pivot point between the neckline and 50% of the TP level 2 weight it negatively but less so than level 1. • S/R Level 3: distance between neckline and 1st resistance area in % of the total distance between neckline and take profit. This is not for road blocks but pivot points etc before the initial run up/down in price. I have this set to 70% , this means that if there is a pivot point between the neckline and 70% of the TP level 3 weight it negatively but less so than level 1 & level 2. • Checkboxes are self explanatory, they are binary options, all are weighted negatively if checked and are weighted positively if unchecked. Divergence values for weighting are neutral if unckecked & weighted positively if checked. • The select options are neutral weighting if set to neutral , if set to For its weighted positive and set to Against weighted negatively. Technical Specification of the Scoring and Band System Overview The scoring system is designed to evaluate a set of technical trade conditions, assigning weights to various criteria that influence the quality of the trade. The system calculates a total score based on both positive and negative conditions. Based on the final score, the system assigns a grade or band (A, B, or C) for positive scores, and a "Negative" label for negative scores. Scoring System The system calculates the score by evaluating a set of 12 conditions (gradeCondition1 to gradeCondition12). These conditions are manually input by the user via checkboxes or dropdowns in a technical indicator (written in Pine Script for TradingView). The score weights vary according to the relative importance of each condition. Condition Breakdown and Weighting: 1. Divergences (GradeCondition1 & GradeCondition2): ◦ 1H Divergence: +5 points if condition is true. ◦ 4H Divergence: +10 points if condition is true (stronger weight than 1H). 2. Support/Resistance at Neckline (GradeCondition3): ◦ Negative if present: -15 points if true (carries significant negative weight). 3. RB near Entry (GradeCondition4): ◦ Very Negative: -20 points if true (this is a critical negative condition). 4. RB can Manage (GradeCondition5): ◦ Slightly Negative: -5 points if true. 5. Institutional Value Zones (GradeCondition6 to GradeCondition8): ◦ For the trade: +5 points. ◦ Against the trade: -5 points. ◦ Neutral: 0 points. 6. S/R between Neckline & Targets (GradeCondition9 to GradeCondition11): ◦ Level 1: -10 points if true, +7 points if false. ◦ Level 2: -7 points if true, +7 points if false. ◦ Level 3: -5 points if true, +7 points if false. ◦ Use fib tool or Gann Box to measure any S/R levels setup according to your preferences. 7. News Timing (GradeCondition12): ◦ News within 3 hours: -20 points if true (strong negative factor). ◦ No upcoming news: +10 points if false. Scoring Calculation Formula: totalScore = score1 + score2 + score3 + score4 + score5 + score6 + score7 + score8 + score9 + score10 + score11 + score12 Where: • score1 to score12 represent the points derived from the conditions described above. Coloring and Visual Feedback: • Positive Scores: Displayed in green. • Negative Scores: Displayed in red. Band System The Band System classifies the total score into different grades, depending on the final value of totalScore. This classification provides an intuitive ranking for trades, helping users quickly assess trade quality. Band Classification: • Band A: If the totalScore is 41 or more. ◦ Represents a highly favorable trade setup. • Band B: If the totalScore is between 21 and 40. ◦ Represents a favorable trade setup with good potential. • Band C: If the totalScore is between 1 and 20. ◦ Represents a trade setup that is acceptable but may have risks. • Negative: If the totalScore is 0 or less. ◦ Represents a poor trade setup with significant risks or unfavorable conditions. Band Calculation Logic (in Pine Script): var string grade = "" if (totalScore >= 41) grade := "Band A" else if (totalScore >= 21) grade := "Band B" else if (totalScore >= 1) grade := "Band C" else grade := "Negative" Technical Key Points: • Highly Negative Conditions: ◦ The system penalizes certain conditions more heavily, especially those that suggest significant risks (e.g., News in less than 3 hours, RB near Entry). • Positive Trade Conditions: ◦ Divergences, Institutional Value Zones in favor of the trade, and lack of significant nearby resistance all contribute positively to the score. • Flexible System: ◦ The system can be adapted or fine-tuned by adjusting the weights of individual conditions according to trading preferences. Use Case Example: • If a trade has 1H and 4H Divergence, RB near Entry (negative), and no upcoming news: ◦ 1H Divergence: +5 points. ◦ 4H Divergence: +10 points. ◦ RB near Entry: -20 points. ◦ No news: +10 points. ◦ Total Score: 5 + 10 - 20 + 10 = 5 → Band C. This modular and flexible scoring system allows traders to systematically evaluate trades and quickly gauge the trade's potential based on technical indicators Summary: Maximum Score: 61 Minimum Score: -97 These are the bounds of the score range based on the current logic of the script. Penunjuk Pine Script®oleh socrates196112
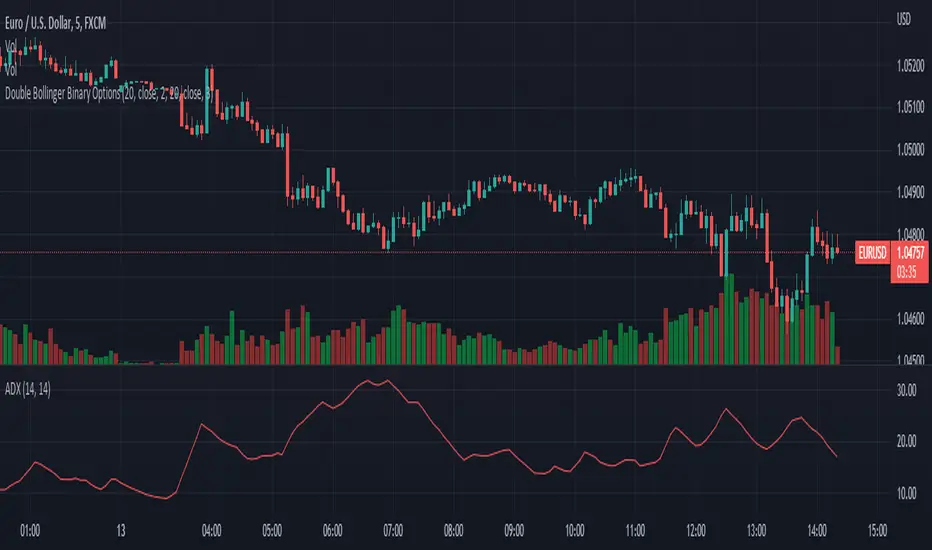
Double Bollinger Binary OptionsThis script uses 2 Bollinger bands and rsi oversold and overbought region to give signals. Basically, it detects those conditions where the market gets spiked in one direction aggressively(mostly during news) and then reverses back, although signals occur less frequently, this strategy is worth trying. Keep the timeframe for 5 minutes and trade for 5 candles i.e. 25 minutes :)Strategi Pine Script®oleh Trade_by_DB1189
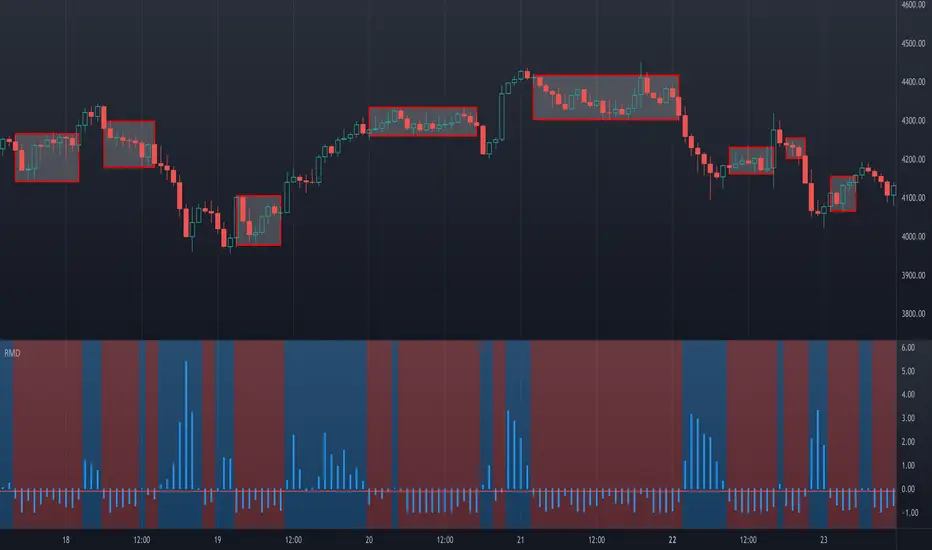
Ranging Market Detector [AstrideUnicorn]Determining if the market is in a trend or a range regime is a very complex problem. And knowing the answer can be, in some situations, the real holy grail. If the trader knows when the market is in a range regime, they can avoid overtrading and make moving average crossover strategies more profitable. A regime switch from a trend to a range can be a signal to close open positions. It can also be helpful when trading such instruments as short-term binary options. When the market is ranging directional moves are not expected, and the trader should be careful as opening a position in such conditions is, by some degree, a random outcome game. Range breakouts trading is one more example when knowing the market regime is critical. We have created an indicator that predicts the current market regime. It smooths the price using the Kalman filter and analyzes the curve's slope. If the absolute value of the slope is low, then the market is in range mode and vice versa. To distinguish between the two regimes, the algorithm compares the absolute value of the slope with its long-term average. HOW TO USE The indicator shows the difference between the absolute slope value and its long-term average as a histogram. When a bar of the histogram is higher than the threshold level presented by the red line, the market is in a trending regime. In this regime, the background of the indicator is blue. When the market is in a range regime, the indicator background turns red. The threshold level helps to control the lag. The greater it is, the more lagging the indicator will be. By default, this value is set to a negative value. It means that the indicator switches from range to trend a little bit earlier than the slope gets higher than the average slope. You can use the value of zero or low negative values to find the optimal tradeoff between the strength of the signals and their lag. SETTINGS The indicator has one input parameter called Threshold. It sets the threshold level described above. Its value should be close to zero. The less the value is, the less is the indicator's lag, but at the same time, the less confirmed the regime-switching signals are. The use cases can be very different. And as the code is open, you can also use the indicator as a building block for your custom trading strategies. Let us know your thoughts and suggestions! Penunjuk Pine Script®oleh AstrideUnicorn1414 1.2 K
Evan Cabral's Quarter Theory by MrTuanDoanThis indicator is based on Evan Cabral's Market Timing Strategy. In Binary Option or High Frequency Forex (HFX), it's very common to see the market make reversals at hours and half hours. This indicator just simply draw vertical lines at each quarter of the hour. You should change the color and opacity to fit your chart style. With this indicator, you're going to know when to positions yourself with more accuracy on trade setups. Note It works best if you take your reversal trade at the top of the hour using your other (overbought/oversold) confirmation using RSI, Stoch RSI, DMI, etc. It works better if you take your trade at resistance/support zones You should pay attention to the direction the market is going before the hour (or half hour) and looking at how the direction changes going into the hour or after it. Please backtest before taking real trades Penunjuk Pine Script®oleh MrTuanDoanTelah dikemas kini 22203
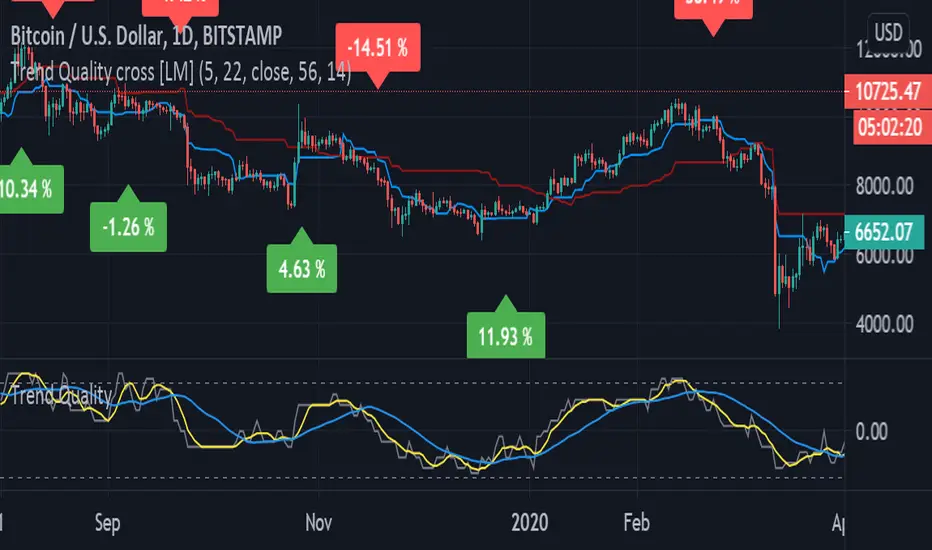
Trend Quality cross [LM]Hi Guys, I would like to introduce you Trend quality cross indicator. The idea orginallybcomes from @kruskakli and his indicator "Trend Quality" so shout-out to him I have modified the indicator to display just binary option buy/sell and display diff percentage from previous cross. Also there is a difference that I have double smoothed tq indicator results to give less false signals. and also added for the same reason like in my other indicator vpci ma cross base line and conversion line from ichimoku. Any suggestions are welcomedPenunjuk Pine Script®oleh lmatl22277
Williams Fractals with Alerts by MrTuanDoanCustom William Fractals for alerts and educational purpose. Added custom alerts for Williams Fractals. Also added filter to show less fractals on chart. The simple idea how I use fractals in Binary Option is to determine temporary resistance and support. Simple strategy: - Mark Resistance/Support on higher time frame (e.g. 5M) - Set an alert for new fractal - Whenever a new fractal that appears close to your marked Resistance/Support, go to lower time frame (e.g. 1M) - Wait for rejection at the level that lower than new down fractal (or higher than new up fractal). - Enter with the same expiry of lower time frame. Good luck and happy trading. :-)Penunjuk Pine Script®oleh MrTuanDoan1212 1.6 K
Viejito MMR2 UpperThis set will help you get better opportunities to trade binary options. When price is close to any line, use the fibonacci to get confirmation and you can take 5 minutes trades. Always analyze in 5 min timeframePenunjuk Pine Script®oleh andresplazas11100
Stochastic binary option styleUsing Time Frames For Trend – You can also use different time frames to determine trends with stochastic. To do this you will need to use two different time frame charts, I like to use the weekly/daily or daily/hourly combination depending on the asset. Weekly/daily works well with stocks and indices while I prefer the shorter time frame for currency and commodities. This is how it works; stochastic on the longer term chart sets trend, stochastic on the shorter term chart gives the signal. If, on the weekly chart, stochastic is pointing up then you would trade bullish signals on the daily charts. Or if using the daily/hourly combo the stochastic on the daily would set trend while signals would come from the hourly chart. Green color bar and background means k is > d, the crowd is bullish (trend is bullish, a bullish crossover is happened), red is the contrary (bears are the leaders) Credit to Michael HodgesPenunjuk Pine Script®oleh Biticon1133
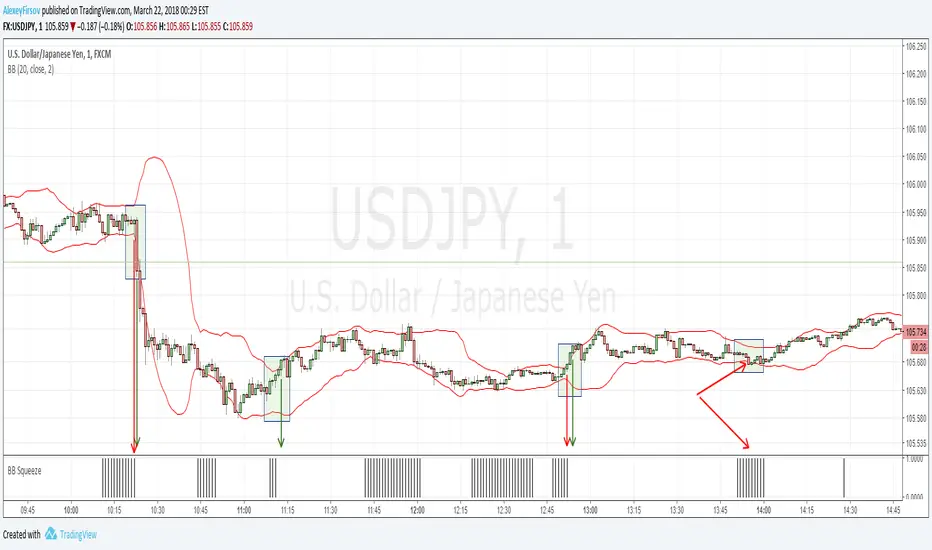
Bollinger Bands SqueezeEnglish: Simple histogram, showing Squeeze of Bollinger Bands. Usage is simple - when price is in Squeeze, no entries in any direction. For using with Bollinger Bands indicator, including binary options. Russian Простой индикатор, наглядной отображающий стадию Сжатия лент Боллинджера. Простой в использовании - когда цена в Сжатии - не входим в сделку. Особенно эффективен при связке с индикатором лент Боллинджера и входе в сделку при раскрытии лент. Также применим для бинарных опционов Example/Пример Penunjuk Pine Script®oleh AlexeyFirsov77 1 K
Noro's BinaryHacker v1.0The indicator isn't redrawn (the last candle can be redrawn because it still changes). NOT indicator shows a bottom of the market or top of the market!!! The indicator shows what there will be a color of the following candle. The index up under the current candle means that the following candle will be growing (there will be a green candle). And vice versa. The index down under the current candle means that the following candle will be falling (there will be a red candle). The indicator shows only on one following candle. It is not the trend indicator! Well for Forex and binary options.Penunjuk Pine Script®oleh ROBO_Trading11225
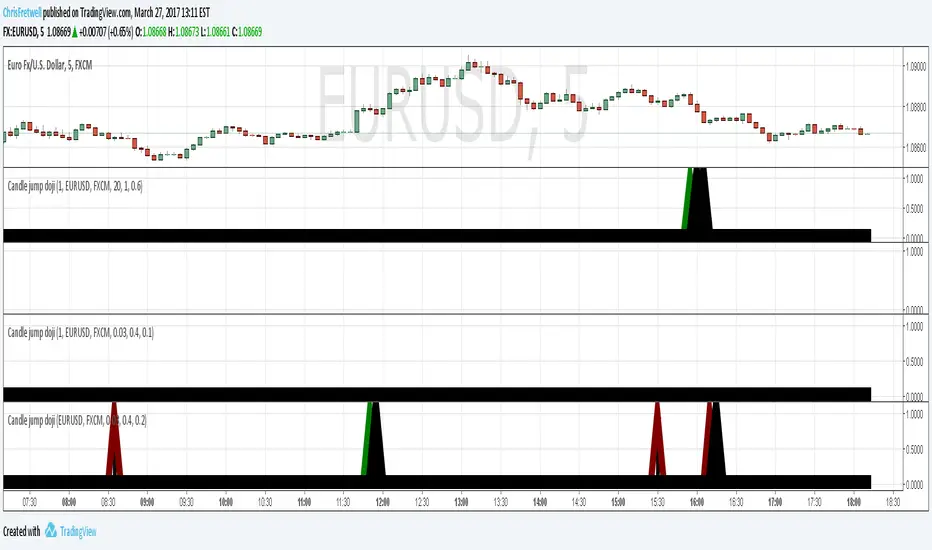
Candle pattern doji-harami just something I wipped together. Unused code still in script and left there for you to experiment with. simple classic doji candle pattern recognition code. Binary option use recommended. red arrow suggest down trade and green for up trade. if market direction fails then a black arrow pops up on next candle. this is to help quickly judge the accuracy while experimenting with input numbers. Penunjuk Pine Script®oleh ChrisFretwell11116